
Quick Start Guide#
This guide will walk you through a realistic spectral fitting example using GalSpec. We’ll analyze an SDSS spectrum of an AGN (SDSS J000605.59-092007.0) to fit both the continuum and emission lines, and extract physical parameters.
## The Dataset: SDSS J000605.59-092007.0
We’ll analyze a real spectrum from the Sloan Digital Sky Survey (SDSS) of an active galactic nucleus (AGN). This object has:
Redshift: z = 0.0699
Coordinates: 00:06:05.59, -09:20:07.0
Features: Strong emission lines (Hα, Hβ, [O III], [N II], [S II])
Host galaxy: Visible stellar absorption features
You can download this spectrum from the SDSS database or use your own data.
## Step 1: Load and Prepare the Spectrum
First, let’s load the data and apply necessary corrections:
import numpy as np
import matplotlib.pyplot as plt
from astropy.io import fits
import extinction

# Load SDSS spectrum
hdul = fits.open('spec-0651-52141-0434.fits')
flux_obs = hdul[1].data['flux'].astype(float)
loglam = hdul[1].data['loglam'].astype(float)
wave_obs = 10**loglam  # Convert log wavelength to linear
ivar_obs = hdul[1].data['ivar'].astype(float)
ferr_obs = np.sqrt(1/ivar_obs)

# Apply corrections
zred = 0.069907  # Redshift from NED
A_v = 0.105      # Galactic extinction from NED

# Correct for Galactic extinction
A_lambda = extinction.ccm89(wave_obs, A_v, r_v=3.1)
wave_rest = wave_obs / (1 + zred)  # Convert to rest frame
flux_dered = flux_obs * 10**(0.4 * A_lambda)
ferr_dered = ferr_obs * 10**(0.4 * A_lambda)

# Plot the spectrum
plt.figure(figsize=(15, 5))
plt.step(wave_rest, flux_dered, where='mid', color='k', alpha=0.8)
plt.xlabel('Rest Wavelength (Å)')
plt.ylabel('Flux (10⁻¹⁷ erg s⁻¹ cm⁻² Å⁻¹)')
plt.title('SDSS J000605.59-092007.0')
plt.show()
Result:
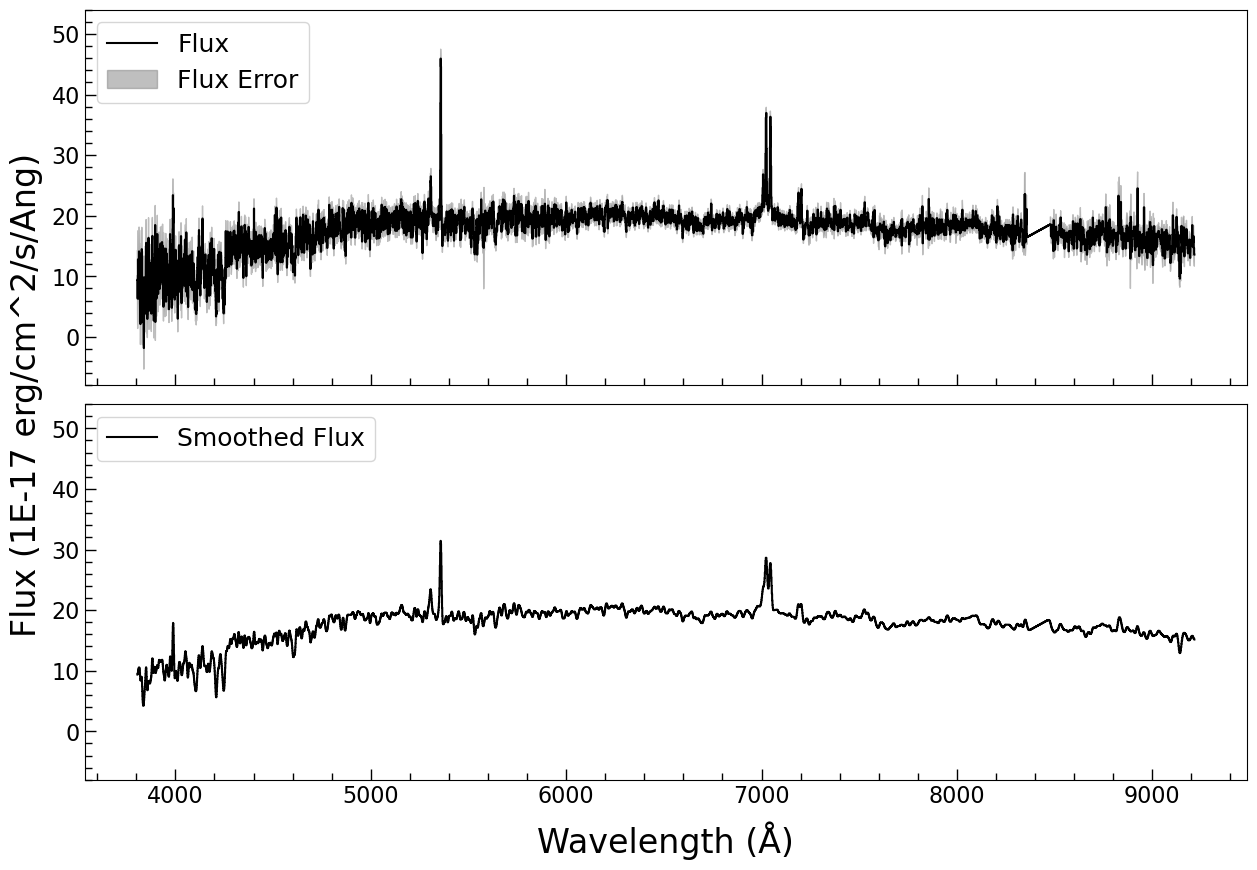
This shows the original (blue) and dereddened (red) spectrum, with the flux error shown in gray. The bottom panel shows the smoothed spectrum after Galactic extinction correction and conversion to rest frame.
## Step 2: Fit the Stellar Continuum
For AGN with host galaxy contamination, we need to fit both the stellar continuum (host galaxy) and the AGN power law continuum.
We’ll use stellar templates to fit the host galaxy:
import sys
sys.path.append('/path/to/GalSpec')
import sagan
from astropy.modeling import models, fitting

# Define continuum windows (line-free regions)
cont_windows = [
    [3900, 4060],  # Ca II K&H region
    [4170, 4260],
    [4430, 4770],
    [5080, 5550],
    [6050, 6200],
    [6890, 7010]
]

# Create weights for continuum fitting
weights = np.zeros_like(wave_rest)
for window in cont_windows:
    weights[(wave_rest >= window[0]) & (wave_rest <= window[1])] = 1.0

# Define stellar templates (A, F, G, K stars)
velscale = 20  # Velocity scale in km/s
bounds = {'sigma': (velscale, 300)}

star_A = sagan.StarSpectrum(
    amplitude=1.0, sigma=100, delta_z=0,
    velscale=velscale, Star_type='A', name='A Star', bounds=bounds
)
star_F = sagan.StarSpectrum(
    amplitude=5.0, sigma=100, delta_z=0,
    velscale=velscale, Star_type='F', name='F Star', bounds=bounds
)
star_G = sagan.StarSpectrum(
    amplitude=5.0, sigma=100, delta_z=0,
    velscale=velscale, Star_type='G', name='G Star', bounds=bounds
)
star_K = sagan.StarSpectrum(
    amplitude=3.0, sigma=100, delta_z=0,
    velscale=velscale, Star_type='K', name='K Star', bounds=bounds
)

# Combine stellar templates
stars = star_A + star_F + star_G + star_K

# Tie velocity dispersion and redshift of all stars
for name in ['A Star', 'F Star', 'G Star']:
    stars[name].sigma.tied = sagan.tie_StarSpectrum_sigma('K Star')
    stars[name].delta_z.tied = sagan.tie_StarSpectrum_deltaz('K Star')

# Add AGN power law continuum
powerlaw = models.PowerLaw1D(
    amplitude=10, x_0=5000, alpha=1.7,
    name='PowerLaw', fixed={'x_0': True}
)

# Combine all continuum components
continuum_model = stars + powerlaw

# Fit the continuum
fitter = fitting.LevMarLSQFitter()
continuum_fit = fitter(
    continuum_model, wave_rest, flux_dered,
    weights=weights, maxiter=10000
)

# Plot the continuum fit
fig, ax = plt.subplots(figsize=(15, 5))
ax.step(wave_rest, flux_dered, where='mid', color='k', alpha=0.8, label='Data')
ax.plot(wave_rest, continuum_fit(wave_rest), 'r-', linewidth=2, label='Continuum Fit')
for window in cont_windows:
    ax.axvspan(window[0], window[1], color='C1', alpha=0.3)
ax.set_xlabel('Rest Wavelength (Å)')
ax.set_ylabel('Flux (10⁻¹⁷ erg s⁻¹ cm⁻² Å⁻¹)')
ax.legend()
plt.show()

# Get stellar velocity dispersion
sigma_star = continuum_fit['K Star'].sigma.value
print(f"Stellar velocity dispersion: {sigma_star:.1f} km/s")
Result:
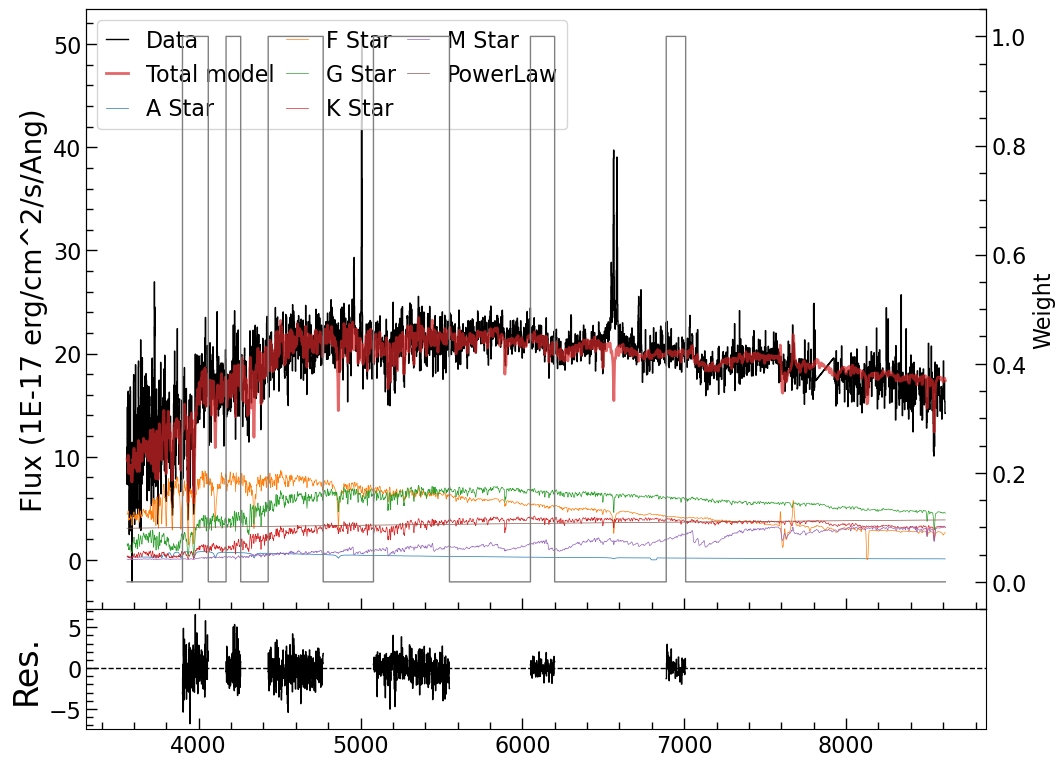
The continuum fit (red) combines stellar templates (A, F, G, K stars) with an AGN power law. The orange shaded regions show the continuum windows used for fitting. The residual plot below shows the quality of the fit.
Let’s zoom in on the Ca II H&K region to verify the stellar absorption features:
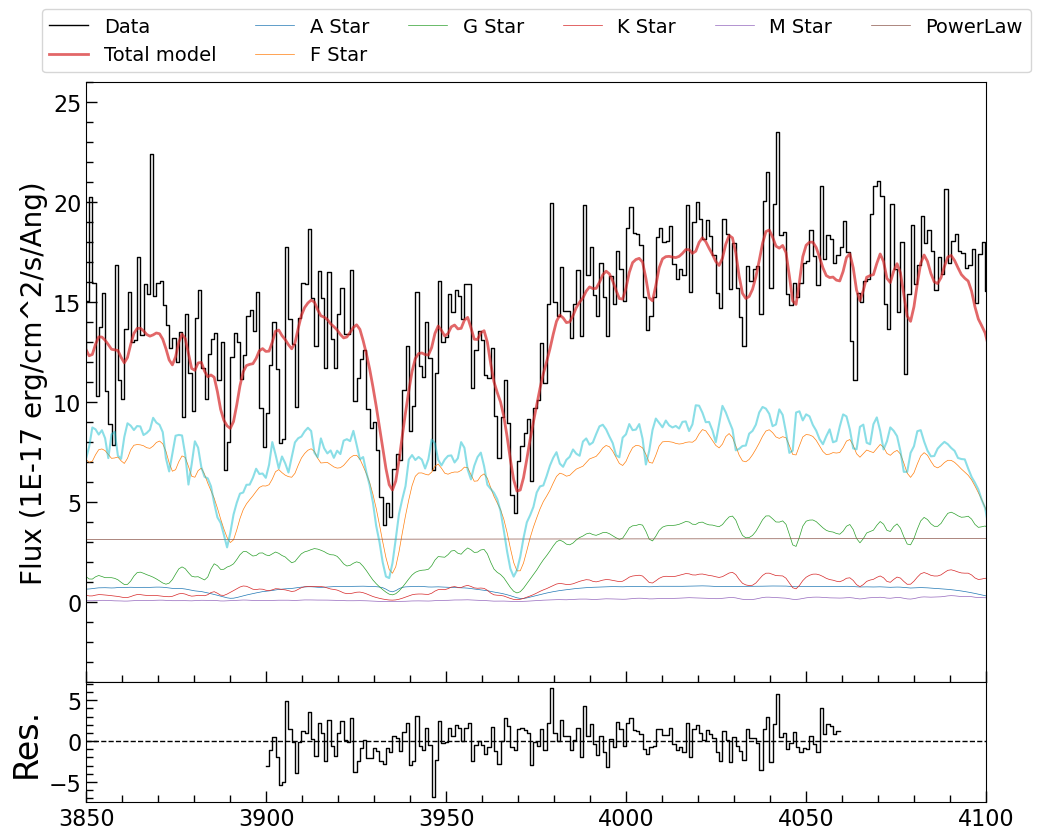
The purple line shows the F-star template, demonstrating the stellar absorption features that were successfully fit.
Note
Convenience Alternative: Instead of creating individual StarSpectrum models
and manually tying their parameters, you can use the Multi_StarSpectrum model
which automatically combines multiple stellar templates (A, F, G, K, M) with a
shared velocity dispersion:
# Simpler approach using Multi_StarSpectrum
stars = sagan.Multi_StarSpectrum(
    amp_0=1.0,  # A star amplitude
    amp_1=5.0,  # F star amplitude
    amp_2=5.0,  # G star amplitude
    amp_3=3.0,  # K star amplitude
    amp_4=2.0,  # M star amplitude
    sigma=100,  # Shared velocity dispersion
    velscale=20,
    Star_types=['A', 'F', 'G', 'K', 'M'],
    bounds={'sigma': (velscale, 300)}
)

# All stars automatically share the same sigma parameter
continuum_model = stars + powerlaw
## Step 3: Extract Emission Line Spectrum
Subtract the continuum to isolate the emission lines:
# Subtract continuum to get emission lines
flux_lines = flux_dered - continuum_fit(wave_rest)

plt.figure(figsize=(15, 5))
plt.step(wave_rest, flux_lines, where='mid', color='k', alpha=0.8)
plt.xlabel('Rest Wavelength (Å)')
plt.ylabel('Flux (10⁻¹⁷ erg s⁻¹ cm⁻² Å⁻¹)')
plt.title('Emission Line Spectrum')
plt.show()
Result:
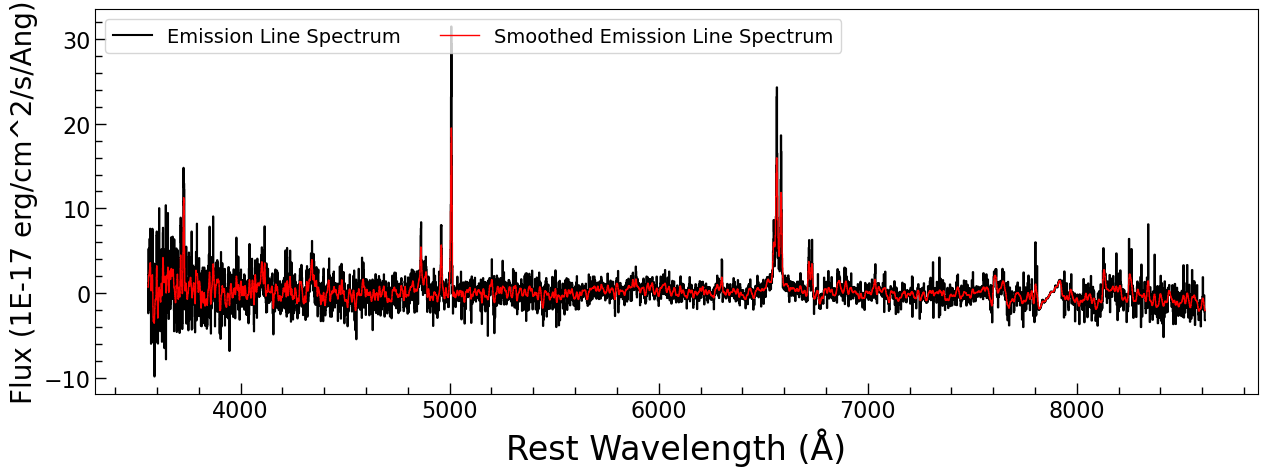
The emission line spectrum shows clear detection of Hα, Hβ, [O III] λ4959,5007, [N II] λ6548,6583, and [S II] λ6716,6731.
## Step 4: Fit Emission Lines
Now let’s fit the emission lines. We’ll start with the [S II] doublet to create a narrow line template:
### 4a. Fit [S II] Doublet for Narrow Line Template
# Load emission line wavelengths
line_wave_dict = sagan.line_wave_dict
wavec_sii_6716 = line_wave_dict['SII_6716']
wavec_sii_6731 = line_wave_dict['SII_6731']

window = [6680, 6780]
fltr = (wave_rest > window[0]) & (wave_rest < window[1])
wave_sii = wave_rest[fltr]
flux_sii = flux_lines[fltr]

cont = models.PowerLaw1D(amplitude=0, x_0=6730., alpha=0,
                         fixed=dict(x_0=True, alpha=True, amplitude=True),
                         name='Cont SII')

ns2 = sagan.Line_MultiGauss_doublet(
    n_components=2,
    amp_c0=6.1, amp_c1=5.8, dv_c=93.0, sigma_c=105.0,
    amp_w0=0.1, dv_w0=0, sigma_w0=200,
    wavec0=wavec_sii_6716, wavec1=wavec_sii_6731, name='[SII]'
)

m_init = cont + ns2
fitter = fitting.LevMarLSQFitter()
m_fit_sii = fitter(m_init, wave_sii, flux_sii, maxiter=10000)
Result:
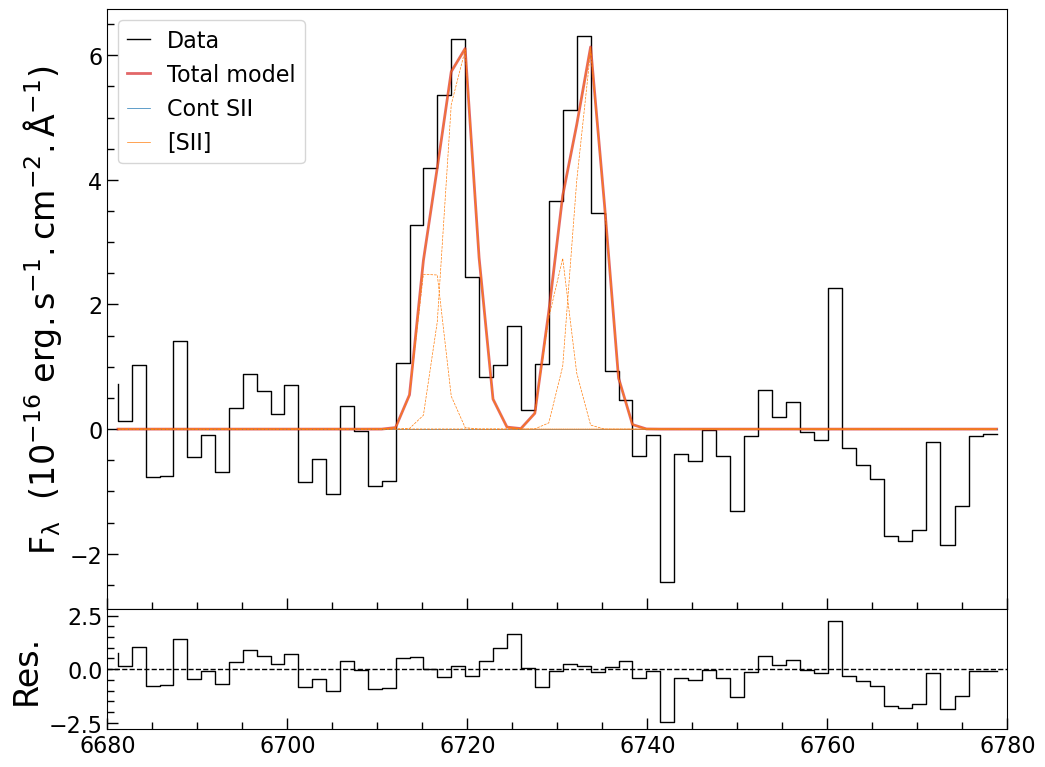
The [S II] doublet fit provides the narrow line template. The profile shows both core components (narrow) and weak wings (broad).
### 4b. Fit Hα Complex
wavec_ha = line_wave_dict['Halpha']
wavec_nii_6583 = line_wave_dict['NII_6583']
wavec_nii_6548 = line_wave_dict['NII_6548']

window = [6400, 6900]
fltr = (wave_rest > window[0]) & (wave_rest < window[1])
wave_ha = wave_rest[fltr]
flux_ha = flux_lines[fltr]

# Generate narrow line template from [S II] fit
velc_temp = np.arange(-3e3, 3e3, 5)
wave_temp = (1 + velc_temp / sagan.constants.ls_km) * wavec_sii_6716
m_temp = sagan.Line_MultiGauss(
    n_components=2, amp_c=1, dv_c=0, sigma_c=m_fit_sii['[SII]'].sigma_c,
    amp_w0=m_fit_sii['[SII]'].amp_w0, dv_w0=m_fit_sii['[SII]'].dv_w0,
    sigma_w0=m_fit_sii['[SII]'].sigma_w0,
    wavec=wavec_sii_6716
)
flux_temp = m_temp(wave_temp)
flux_temp /= np.max(flux_temp)

# Define line models
bha = sagan.Line_MultiGauss(
    n_components=1, amp_c=4.0, dv_c=150, sigma_c=1100,
    wavec=wavec_ha, name='bHalpha'
)

nha = sagan.Line_template(
    template_velc=velc_temp, template_flux=flux_temp,
    amplitude=17.0, dv=86.0, wavec=wavec_ha, name='nHalpha'
)

# A doublet of templated lines is one model: one amplitude, one shift, and the
# atomic ratio for the second peak.  Line_template_doublet is exactly the two
# Line_template models added together, with the ratio tie already in place.
nn2 = sagan.Line_template_doublet(
    template_velc=velc_temp, template_flux=flux_temp,
    amp_c0=16.5, amp_c1=16.5 / 2.96, dv_c=0,
    wavec0=wavec_nii_6583, wavec1=wavec_nii_6548, name='NII'
)

# [S II] keeps both peaks free: 6716/6731 is a density diagnostic, not a constant.
ns2 = sagan.Line_template_doublet(
    template_velc=velc_temp, template_flux=flux_temp,
    amp_c0=5.2, amp_c1=5.6, dv_c=0,
    wavec0=wavec_sii_6716, wavec1=wavec_sii_6731, name='SII'
)

m_init = bha + nha + nn2 + ns2

# Tie parameters: every narrow line sits at the velocity of narrow H-alpha
for ln in ['NII', 'SII']:
    m_init[ln].dv_c.tied = sagan.tie_template_dv('nHalpha')

fitter = fitting.LevMarLSQFitter()
m_fit_ha = fitter(m_init, wave_ha, flux_ha, maxiter=10000)
Result:
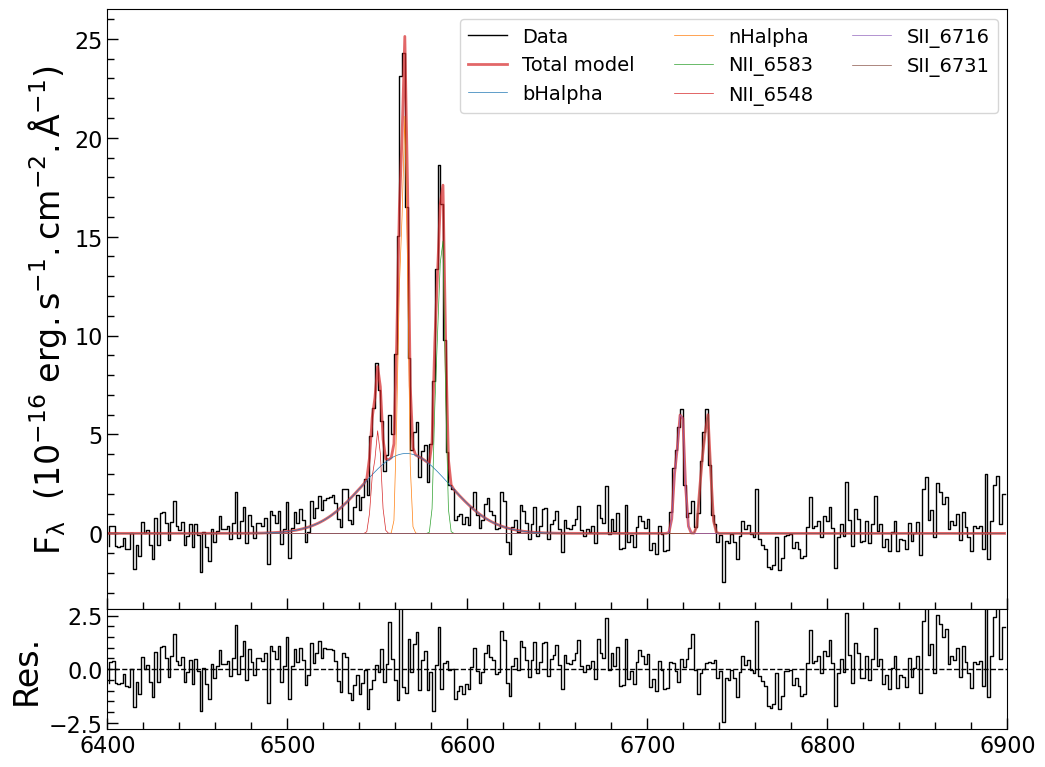
The Hα complex shows: - Broad Hα (blue): σ ≈ 900 km/s from the broad-line region, i.e. a FWHM of about 2 100 km/s - Narrow components (red, orange, green): Forbidden lines [N II] and [S II] with same velocity - The residual panel shows excellent fit quality
### 4c. Fit Hβ + [O III] + Hα
Now let’s fit the full Hβ region and combine with Hα:
wavec_hb = line_wave_dict['Hbeta']
wavec_oiii_5007 = line_wave_dict['OIII_5007']
wavec_oiii_4959 = line_wave_dict['OIII_4959']

window_list = [[4700, 5100], [6400, 6900]]
fltr = np.zeros_like(wave_rest, dtype=bool)
for window in window_list:
    fltr |= (wave_rest > window[0]) & (wave_rest < window[1])
wave_hb = wave_rest[fltr]
flux_hb = flux_lines[fltr]

bhb = sagan.Line_MultiGauss(
    n_components=1, amp_c=3.3, dv_c=98.8, sigma_c=1272.7,
    wavec=wavec_hb, name='bHbeta'
)

nhb = sagan.Line_template(
    template_velc=velc_temp, template_flux=flux_temp, amplitude=17.0, dv=86.0,
    wavec=wavec_hb, name='nHbeta'
)

no3 = sagan.Line_template_doublet(
    template_velc=velc_temp, template_flux=flux_temp,
    amp_c0=16.5, amp_c1=16.5 / 2.98, dv_c=0,
    wavec0=wavec_oiii_5007, wavec1=wavec_oiii_4959, name='OIII'
)

no3_w = sagan.Line_MultiGauss_doublet(
    n_components=1, amp_c0=3.0, amp_c1=3.0/2.98, dv_c=0, sigma_c=300,
    wavec0=wavec_oiii_4959, wavec1=wavec_oiii_5007, name='[OIII]_w'
)

m_init = bhb + nhb + no3 + no3_w + m_fit_ha

# Tie parameters: the narrow lines move with narrow H-alpha, the [O III] wing's
# second peak keeps its atomic ratio, and broad H-beta moves with broad H-alpha
m_init['nHbeta'].dv.tied = sagan.tie_template_dv('nHalpha')
m_init['OIII'].dv_c.tied = sagan.tie_template_dv('nHalpha')
m_init['OIII'].amp_c1.tied = sagan.tie_MultiGauss_doublet_ratio('OIII', ratio=2.98)
m_init['[OIII]_w'].amp_c1.tied = sagan.tie_MultiGauss_doublet_ratio('[OIII]_w', ratio=2.98)
m_init['bHbeta'].dv_c.tied = sagan.tie_MultiGauss_dv_c('bHalpha')

fitter = fitting.LevMarLSQFitter()
m_fit_hb = fitter(m_init, wave_hb, flux_hb, maxiter=10000)
Result:
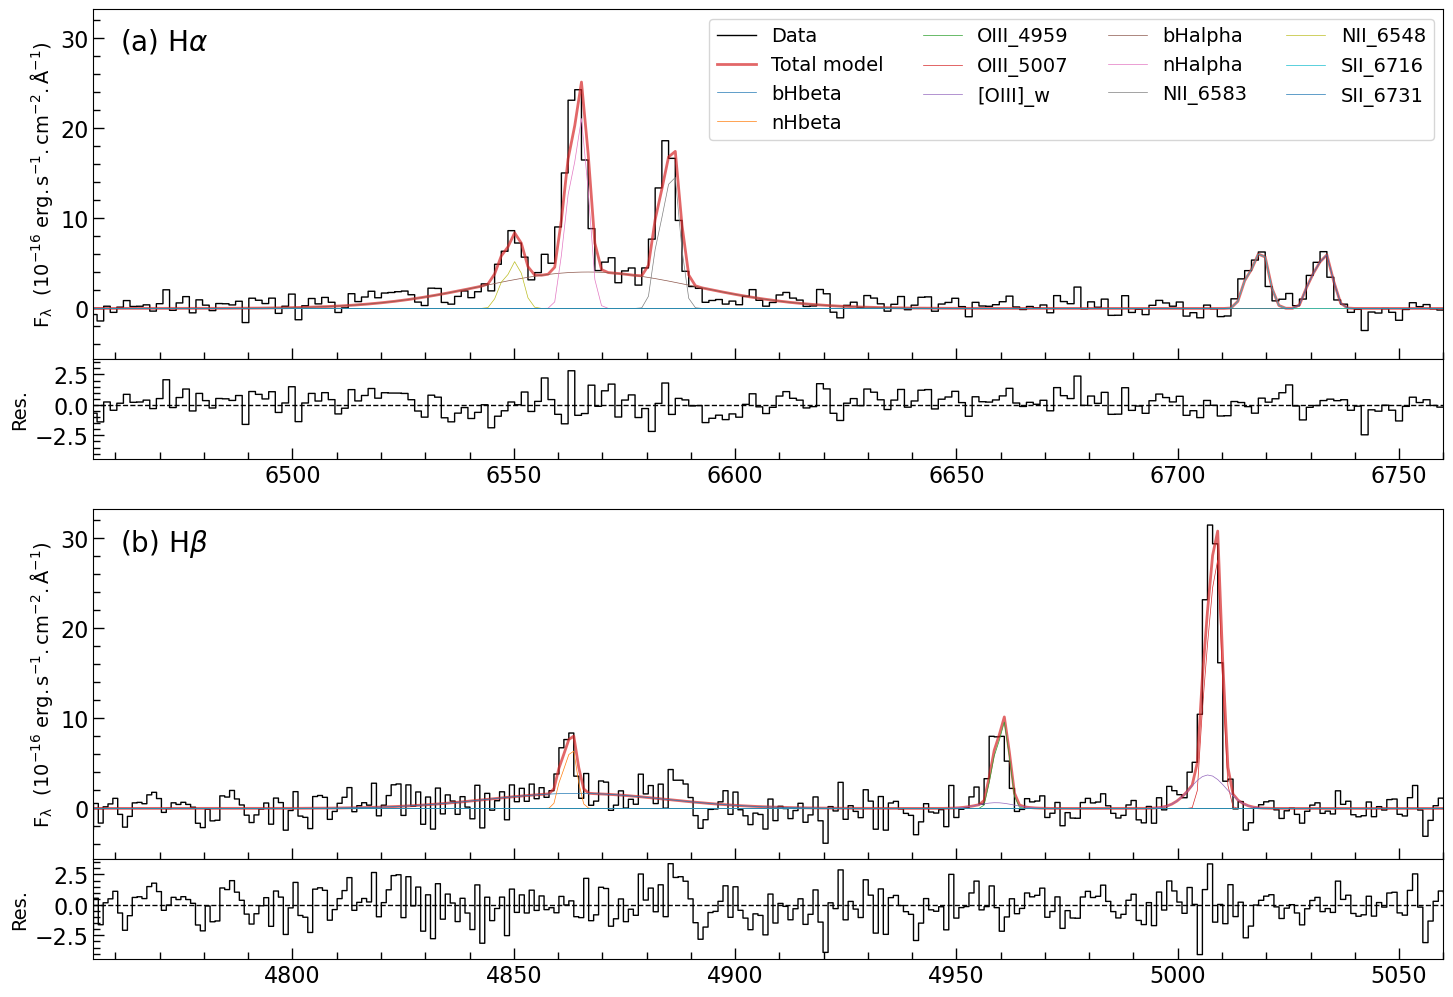
Panel (a) shows Hα with narrow forbidden lines. Panel (b) shows Hβ + [O III]. The [O III] lines show both a narrow core and broad wings (blue), likely indicating outflow.
## Step 5: Calculate Physical Parameters
Now let’s calculate line fluxes and physical parameters:
from astropy.cosmology import Planck18 as cosmo

# Calculate line fluxes by integrating one component over its own window
def integrate_line_flux(component, wave, scale=1e-17, comp=None):
    """Integral of one component, in erg/s/cm^2.

    A template line is normalised to unit *peak*, so its integral is the peak
    times the profile's own area -- not the sigma sqrt(2 pi) of a Gaussian.
    Integrating the component numerically gets that right for either.

    ``comp`` picks one line of a doublet (``component.single(wave, comp)``):
    [N II] and [O III] are doublets, and the BPT axes want 6583 and 5007
    alone, not 6583+6548 and 5007+4959.
    """
    flux = component(np.asarray(wave)) if comp is None else component.single(wave, comp)
    return np.trapezoid(np.asarray(flux) * scale, wave)

# Get fluxes (in erg/s/cm^2): H-alpha lines in the H-alpha window, the rest in
# the H-beta + [O III] window they were fitted on
flux_hb = integrate_line_flux(m_fit_hb['bHbeta'], wave_hb)
flux_ha = integrate_line_flux(m_fit_hb['bHalpha'], wave_ha)
# The narrow Balmer lines as well.  The BPT axes below divide by them, because
# [N II], [S II] and [O III] are forbidden lines and come from the narrow-line
# region -- the broad lines are a different gas at a different radius.
flux_nhb = integrate_line_flux(m_fit_hb['nHbeta'], wave_hb)
flux_nha = integrate_line_flux(m_fit_hb['nHalpha'], wave_ha)
flux_o3 = integrate_line_flux(m_fit_hb['OIII'], wave_hb, comp=0)   # 5007 alone
flux_n2 = integrate_line_flux(m_fit_hb['NII'], wave_hb, comp=0)    # 6583 alone
flux_s2 = integrate_line_flux(m_fit_hb['SII'], wave_hb)            # both lines: the
                                                                  # BPT [S II] axis
                                                                  # sums the pair

print(f"broad Hβ flux: {flux_hb:.2e} erg/s/cm^2")
print(f"broad Hα flux: {flux_ha:.2e} erg/s/cm^2")
print(f"narrow Hβ flux: {flux_nhb:.2e} erg/s/cm^2")
print(f"narrow Hα flux: {flux_nha:.2e} erg/s/cm^2")
print(f"[O III] λ5007 flux: {flux_o3:.2e} erg/s/cm^2")
print(f"[N II] λ6583 flux: {flux_n2:.2e} erg/s/cm^2")
print(f"[S II] flux: {flux_s2:.2e} erg/s/cm^2")

# The two BPT axes: narrow forbidden line over narrow Balmer line
print(f"log [N II]6583/Hα: {np.log10(flux_n2 / flux_nha):+.2f}")
print(f"log [O III]5007/Hβ: {np.log10(flux_o3 / flux_nhb):+.2f}")

# Calculate continuum luminosity at 5100 Å
lum_dist = cosmo.luminosity_distance(zred).to('cm').value
lam_flam = continuum_fit['PowerLaw'].amplitude.value * 5100 * 1e-17
nu_lnu = lam_flam * 4 * np.pi * lum_dist**2
print(f"L_5100: {nu_lnu:.2e} erg/s")

# Estimate black hole mass: the FWHM of broad H-beta, from its fitted sigma
fwhm_hb = m_fit_hb['bHbeta'].sigma_c.value * 2.3548
log_mbh = np.log10((fwhm_hb/1000)**2 * (nu_lnu/1e44)**0.533) + 6.91
print(f"Black hole mass: 10^{log_mbh:.2f} M_sun")
Output:
broad Hβ flux: 9.20e-16 erg/s/cm^2
broad Hα flux: 2.37e-15 erg/s/cm^2
narrow Hβ flux: 2.49e-16 erg/s/cm^2
narrow Hα flux: 1.00e-15 erg/s/cm^2
[O III] λ5007 flux: 1.25e-15 erg/s/cm^2
[N II] λ6583 flux: 7.83e-16 erg/s/cm^2
[S II] flux: 5.33e-16 erg/s/cm^2
log [N II]6583/Hα: -0.11
log [O III]5007/Hβ: +0.70
L_5100: 2.28e+42 erg/s
Black hole mass: 10^6.87 M_sun
Note
Two choices are being made in that block, and both change the answer.
[O III] and [N II] are doublets, so their fluxes are taken one line at a
time with single(): the numbers above are the 5007 and 6583 lines, which is
what the BPT axes use. Integrating the whole component would fold in 4959 and
6548 (1/2.98 and 1/2.96 of the main line) and move the object in the diagram.
The Balmer denominator of those axes is the narrow line, not the total and
not the broad one. [N II], [S II] and [O III] are forbidden lines and come from
the narrow-line region; the broad Balmer lines come from the region around the
black hole, and dividing by them dilutes both ratios until a Seyfert 1 lands
below the Kauffmann+2003 line, in the star-forming corner. With flux_nha and
flux_nhb the object sits at (-0.11, +0.70), which is where the figure below
puts it.
## Step 6: Analyze Physical Properties
### BPT Diagram
Let’s compare our object with AGN samples on the BPT (Baldwin-Phillips-Terlevich) diagnostic diagram:
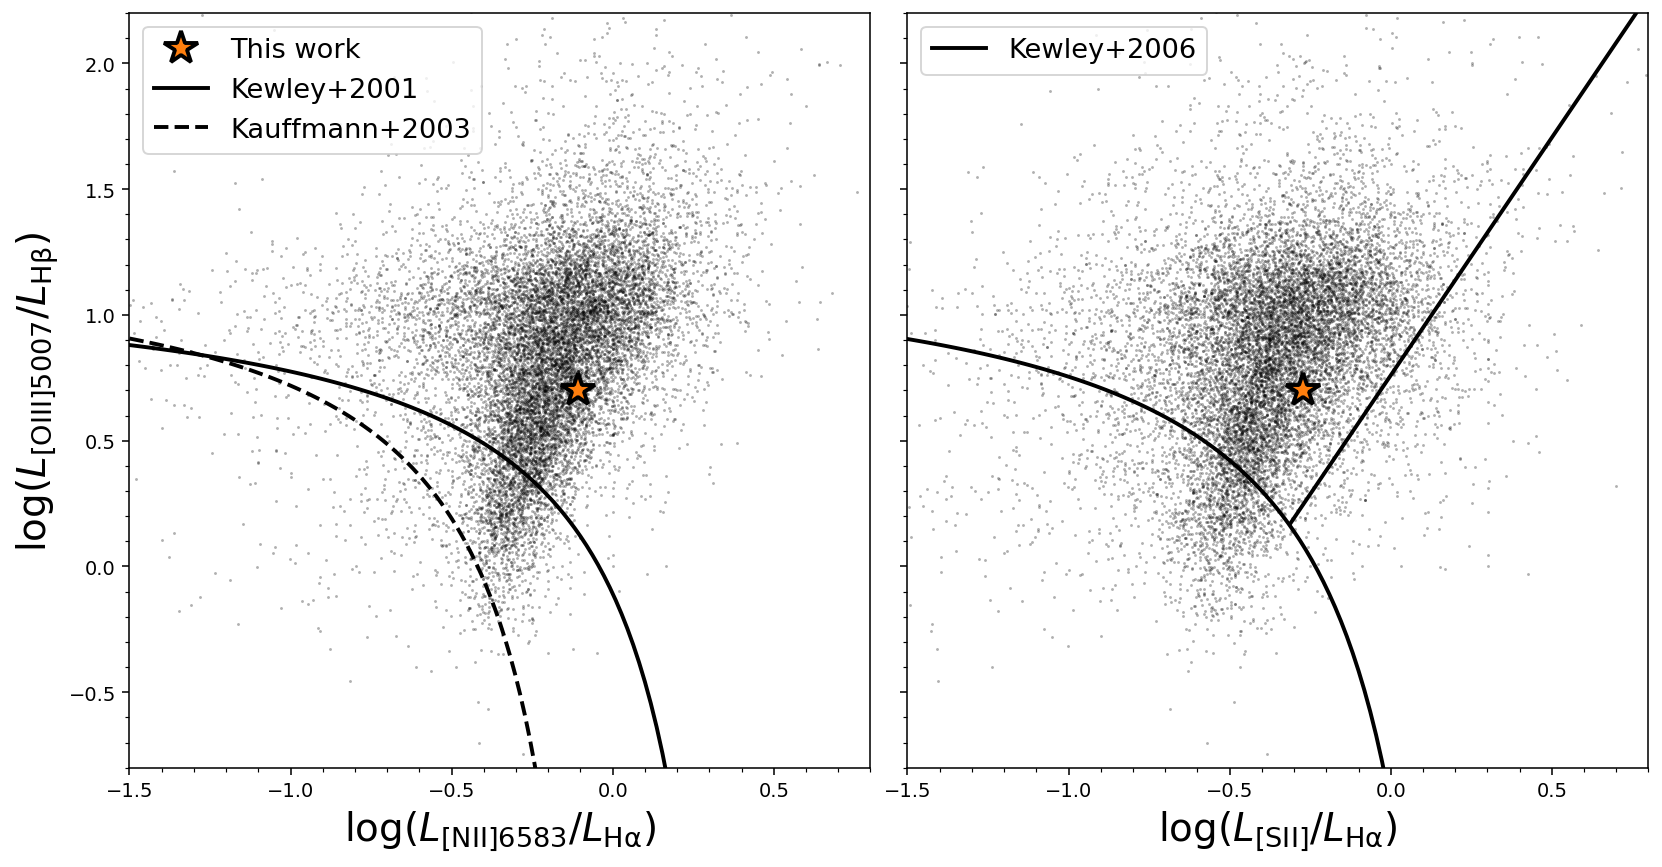
The yellow star shows our object, at log [N II] 6583/Hα = -0.11 and log [O III] 5007/Hβ = +0.70 (narrow lines over narrow Balmer lines, as above). It falls in the AGN region of both diagrams: above the Kewley+2001 line – and so above the Kauffmann+2003 line, which lies below it – in the left panel, and on the Seyfert side of the Kewley+2006 line in the right one – which is what a broad Hα line and [O III]/Hβ = 5 say it should be.
The same two ratios built from the broad Balmer fluxes – flux_n2/flux_ha and
flux_o3/flux_hb – put the star at (-0.48, +0.13), a hair below the Kauffmann+2003 line: the
object would be called star-forming. That is what this page’s recipe did before the narrow
components were integrated, and it is the wrong answer for a Seyfert 1.
### Black Hole Mass - Stellar Velocity Dispersion Relation
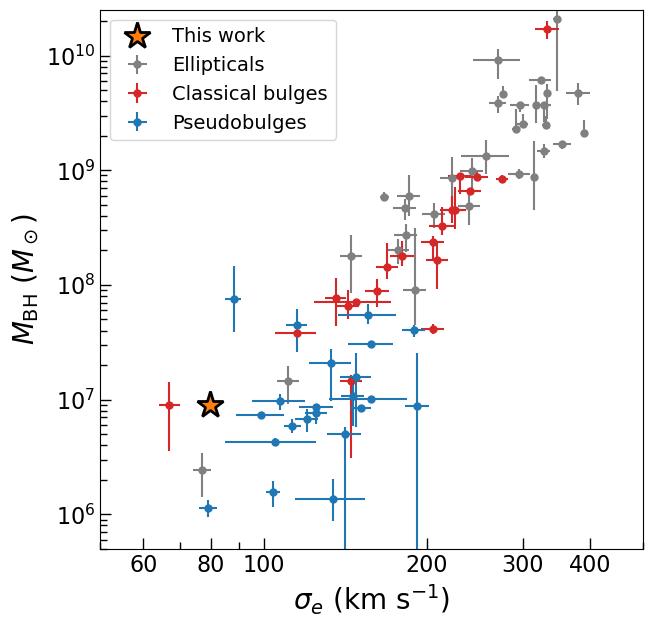
Our object (yellow star) lies close to the M_BH-σ relation for elliptical galaxies (gray points) and classical bulges (red points), consistent with expectations for AGN host galaxies.
Summary#
In this quick start, we’ve:
✅ Loaded and preprocessed an SDSS spectrum
✅ Fitted the stellar continuum and AGN power law
✅ Extracted and fitted emission lines (Hα, Hβ, [O III], [N II], [S II])
✅ Calculated physical parameters (line fluxes, luminosities, BH mass)
✅ Analyzed diagnostic diagrams (BPT, M_BH-σ relation)
Key Results:
Black hole mass: 10^6.87 M_☉
Stellar velocity dispersion: 85.1 km/s
L_5100: 2.28×10^42 erg/s
Classification: AGN (based on BPT diagram)
This is just a basic example. GalSpec can handle much more complex cases:
Multiple emission line components (broad + narrow)
Fe II template fitting
BAL (broad absorption line) fitting
Bayesian parameter estimation with MCMC/nested sampling
Complex line profiles (Gauss-Hermite, multiple components)
Next Steps#
Example: fitting a strong AGN – one AGN spectrum fitted end to end: a power-law continuum, the Fe II template, broad and narrow lines, and a narrow-line profile measured on [O III] before anything else is fitted
Example: measure the black hole and the host galaxy – an SDSS spectrum taken apart into host galaxy and AGN, then the black-hole mass from H$beta$’s width and the 5100 A luminosity
Priors – how to put a prior on each parameter, and what shape to choose
JAX / GPU acceleration – the JAX backend, the batching, and the CPU-versus-GPU comparison
Fitting From a Configuration File – the same model driven from a TOML file, for a whole sample
Look at the example notebooks in the
example/directory of the repository
Advanced Topics#
For more advanced usage, see:
examples/advanced_fitting - MCMC and nested sampling
api/fitting - Fitting algorithms and utilities
api/continuum - Continuum models
api/line_profiles - Line profile models